
2026-09-17
Design Strategies to Reduce Tolerance Stackup in Assembly
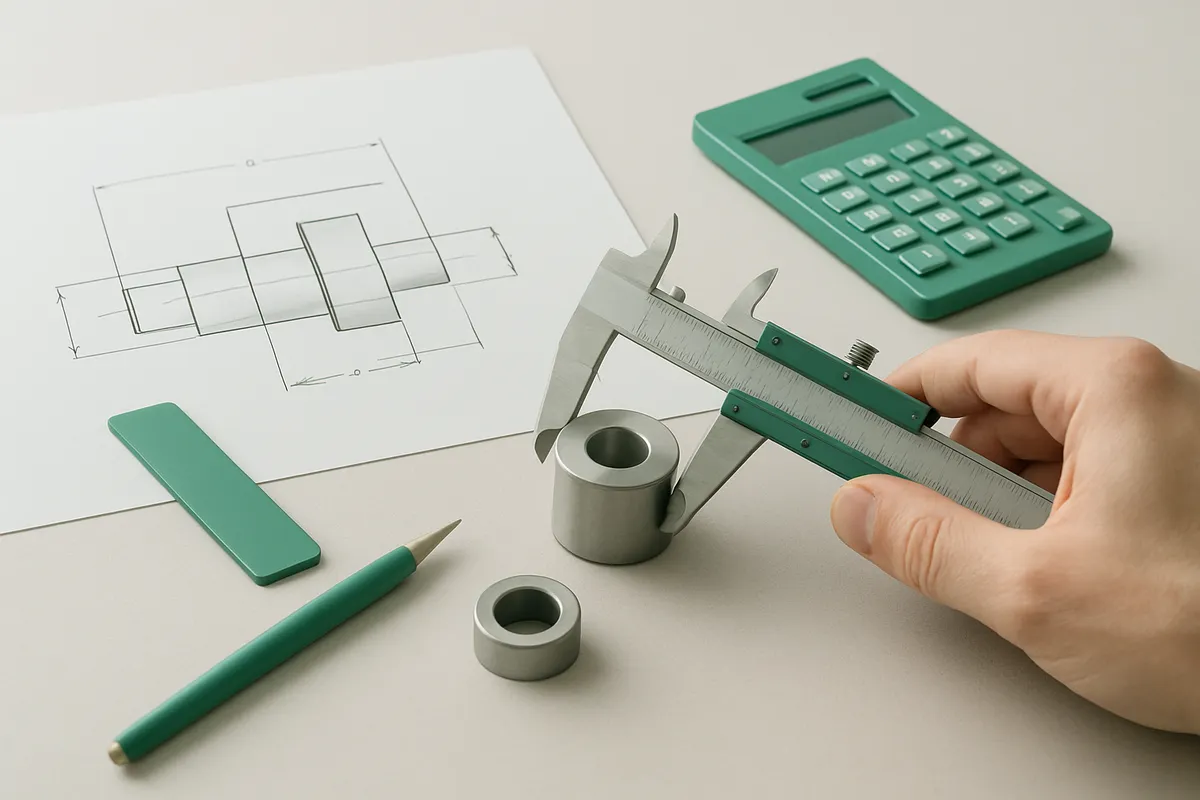
Understanding tolerance stackup assembly is essential. Tolerance stackup in assembly is the cumulative effect of individual part tolerances combining to produce total dimensional variation at a critical feature or fit. It matters because even parts that individually pass inspection can create an assembly that doesn’t fit, function, or seal once their tolerances compound. Left unmanaged, this compounding drives scrap, rework, and field failures, especially in small precision parts where tight fits leave little margin for accumulated error. Managing it requires calculating the tolerance chain early in design, choosing the right analysis method (worst-case or statistical), and applying GD&T to control which dimensions actually matter to the fit.

What Is Tolerance Stackup Assembly and Why Does It Matter in Precision Parts?
Tolerance stackup assembly happens when the small dimensional variations allowed on each individual part add up across a chain of mating components, producing a total variation at the final fit that no single part drawing shows on its own.
Every machined part carries a tolerance, a plus-or-minus range around its nominal dimension. A shaft might be held to ±0.02mm, a housing bore to ±0.03mm, a retaining ring groove to ±0.01mm. None of these look risky in isolation. But when three, five, or ten such parts stack together in an assembly chain, their individual variations combine. Depending on the analysis method, that combination can add arithmetically (worst-case) or blend statistically (root-sum-square), but either way the assembly sees more total variation than any one part’s tolerance suggests. This is particularly relevant for tolerance stackup assembly.
How does tolerance stackup affect scrap rates and rework costs in small precision parts?
Stackup drives scrap and rework because parts that pass individual dimensional inspection can still fail once assembled, and that failure surfaces late, after material and machine time are already spent.
A shaft measured within print tolerance and a bore measured within print tolerance can still produce an interference fit that won’t seat, or a clearance fit so loose the assembly rattles. Inspection at the part level checks each dimension against its own drawing callout; it does not check how that dimension interacts with the four or five other parts it will eventually mate against. The failure only appears at final assembly, the most expensive place to find it, because by then the parts are fully machined, finished, and often already kitted for a customer order.
Small precision parts are especially exposed to this. When a design calls for parts up to 38mm in diameter with nominal clearances measured in hundredths of a millimeter, there is little room left for compounded error before a fit that should be snug becomes an interference, or a clearance that should be tight becomes sloppy. The smaller the nominal dimension, the smaller the margin, and the less tolerance stackup it takes to push an assembly out of spec.
What real-world assembly failures result from tolerance stackup mistakes?
Unaddressed tolerance chains commonly produce interference fits that won’t press together, seals that leak under pressure, and bearing preloads that bind or run loose. When considering tolerance stackup assembly, this point stands out.
A shaft-and-bearing assembly with an unmanaged stackup can end up over-preloaded, causing premature bearing wear or seizure in the field. A housing seal groove that stacks toward the high side of tolerance while its mating cover stacks toward the low side can leave a gap too wide to seal, showing up as a leak months after shipment rather than at the machine shop. Catching these chains during design, before cutting metal, costs a design review. Catching them at final assembly costs scrapped parts and missed ship dates. Catching them in the field costs a warranty claim and a customer’s trust.
How Do You Calculate Tolerance Stackup for Your Assembly?
You calculate tolerance stackup by listing every dimension in the fit path, summing their tolerances in the correct direction, and comparing the total variation against your design limit. That single sentence covers the mechanics, but getting it right in a real tolerance stackup assembly depends on knowing which dimensions actually belong in the chain.
How do you build a tolerance chain and identify critical dimensions?
Start by naming the critical dimension: the gap, clearance, or fit that has to stay within a functional limit for the assembly to work. This might be the air gap between a bearing and a housing shoulder, or the clearance between a connector pin and its socket wall. Everything else in the analysis exists to protect that one number.
Once you know the critical dimension, trace the physical path of parts and features that contribute to it. Draw the assembly as a line diagram if it helps, each part contributes one dimension and one tolerance, and each contribution gets a plus or minus sign depending on whether it adds to or subtracts from the gap. Sigmetrix calls this identifying the “crucial assembly or stack-up” before gathering inputs, and that sequencing matters: pick the wrong critical dimension and the rest of the analysis protects the wrong thing.
Not every dimension on a drawing belongs in the chain. A feature that doesn’t touch, locate, or constrain the critical gap adds noise, not accuracy, including it makes the stackup look tighter than it needs to be and can push you toward unnecessarily expensive tolerances. The discipline here is tracing only the dimensions that physically transmit variation into the gap you’re protecting, in the order they contribute. For those exploring tolerance stackup assembly, this matters.
Can you perform tolerance stackup analysis in Excel, SolidWorks, or NX?
Yes, Excel handles worst-case and RSS math with full visibility into every formula, while CAD-native tools like SolidWorks or NX automate the chain directly from the 3D model. A spreadsheet forces you to enter each dimension and tolerance by hand, which is slower but keeps the entire chain transparent and easy to audit. CAD-embedded tools pull dimensions automatically and update faster when a design changes, at the cost of some visibility into how the software built the chain. Dedicated variation-analysis software such as CETOL 6σ or EZtol adds statistical methods on top of either approach.
Whichever tool you use, the stackup model is only accurate as long as it matches the drawings. If a machinist tightens or loosens a tolerance on a part print, often to make a feature manufacturable at reasonable cost, that change has to flow back into the chain immediately, or the analysis is protecting a fit that no longer exists on the shop floor.
What’s the Difference Between Worst-Case and Statistical Tolerance Analysis?
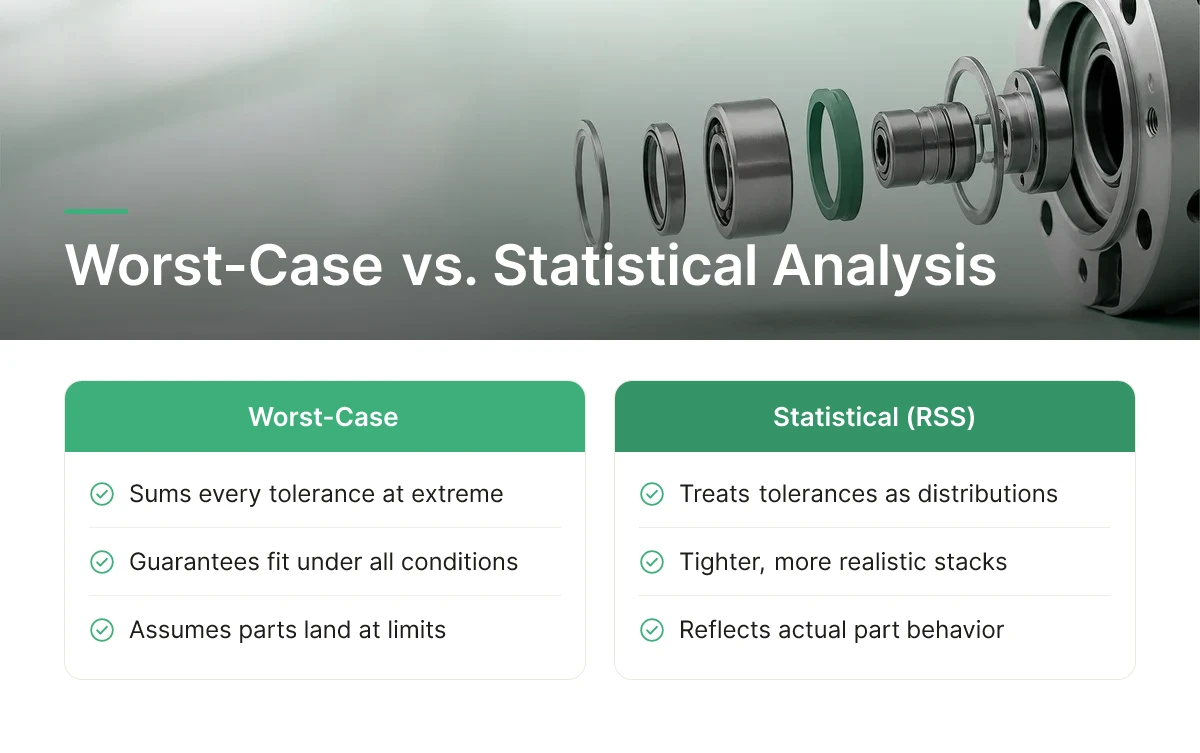
Worst-case analysis sums every tolerance at its extreme for a guaranteed fit; statistical (RSS) analysis treats tolerances as distributions to get tighter, more realistic stacks.
Both methods answer the same question in a tolerance stackup assembly, will these parts fit and function together, but they start from different assumptions about how often parts actually land at their extremes.
Worst-case analysis: every part at its limit
Worst-case analysis adds the maximum or minimum value of every tolerance in the chain, as if every single part happened to come out at its extreme dimension at the same time. This guarantees the assembly fits under any real-world combination, because you’ve already accounted for the least favorable one. The cost is that it often over-constrains the design: to hit a reasonable overall stack, each individual part tolerance has to be tighter than it would need to be in practice, since simultaneous worst-case conditions across five or six parts are statistically rare. This directly impacts tolerance stackup assembly outcomes.
Statistical (RSS) analysis: tolerances as distributions
Root-sum-square analysis assumes each dimension varies according to a distribution, usually centered near nominal, per standard process capability assumptions, and combines the variances rather than the extremes. Sigmetrix notes that tolerance analysis, sometimes called variation analysis, helps engineers predict fit and function issues before parts reach prototyping. RSS stacks are tighter and more realistic for high-volume runs, but they carry a small, calculated probability that some assemblies will fall outside spec, which is why process capability data matters before relying on it.
When should you use worst-case vs. statistical methods in your manufacturing context?
Use worst-case for safety-critical parts, low-volume runs, or anything where a single failure is unacceptable, medical implant components and aerospace fasteners fall here. Use statistical methods for high-volume production where you have process capability data (Cpk) proving your machines hold distributions tight enough to justify the risk. Many engineering teams mix both in a single chain: statistical for high-volume, non-critical features, worst-case for the one dimension that controls safety or interchangeability. That hybrid approach is often the practical answer rather than picking one method for the entire assembly.
At MFG SOLUTION, engineers reviewing incoming specs will flag which approach a print implies before quoting, since that decision shapes which of the five manufacturing methods, CNC turning, Swiss lathe, cold forging, automatic lathe, or CNC mill & turn, fits the tolerance budget and volume.
How Do You Integrate GD&T Principles Into Your Tolerance Stackup Strategy?
GD&T replaces vague plus/minus dimensions with callouts for position, flatness, and perpendicularity, giving each feature a defined zone of variation instead of a guess. This is particularly relevant for tolerance stackup assembly.
How does geometric dimensioning and tolerancing improve your stackup analysis accuracy?
Coordinate tolerancing stacks linear plus/minus values along an axis and assumes every dimension shares the same reference point. In practice, parts get measured from different edges, holes, or surfaces depending on who is running the CMM that day. GD&T fixes this by defining a position, flatness, or perpendicularity zone tied to a controlled datum, so the allowable variation is explicit rather than inferred from a drawing note.
This matters most in a tolerance stackup assembly with five or more mating features, where small ambiguities compound. A position callout with a true tolerance zone tells a machinist and an inspector exactly what “in tolerance” means, cutting disputes over interpretation that otherwise show up as rework late in the build.
Why datum structure controls whether your stackup calculations hold up
A datum structure sets a shared reference frame across mating parts, which is the difference between a stackup that predicts real-world fit and one that doesn’t. If Part A is measured from its outer diameter and Part B is measured from a drilled hole with no common datum between them, the stackup math looks fine on paper but the physical assembly binds. This is the failure mode a coordinate-tolerance drawing hides well: nothing on the print looks wrong, yet the datum scheme silently injects variation nobody accounted for.
Choosing datums in the order they’ll actually be held during machining and inspection, not just what looks clean on the drawing, prevents this from surfacing after parts are already in production.
Bonus tolerance from MMC and LMC
Material condition modifiers like Maximum Material Condition (MMC) and Least Material Condition (LMC) grant additional positional tolerance as a feature departs from its worst-case size. Ignoring bonus tolerance produces a stackup that’s overly conservative, forcing tighter individual tolerances than the assembly actually needs. Applied correctly, GD&T often lets you loosen individual part tolerances without adding assembly risk, which is where the scrap and rework savings come from. Sigmetrix identifies aligning tolerance choices with GD&T standards as central to keeping tolerances both functionally necessary and manufacturable. MFG SOLUTION’s engineering team reviews datum schemes and modifier usage during quoting, before parts up to 38mm in diameter enter production, so the stackup logic is settled ahead of the first cut rather than discovered during final inspection. When considering tolerance stackup assembly, this point stands out.
What Software Tools Should You Use for Tolerance Stackup Analysis?
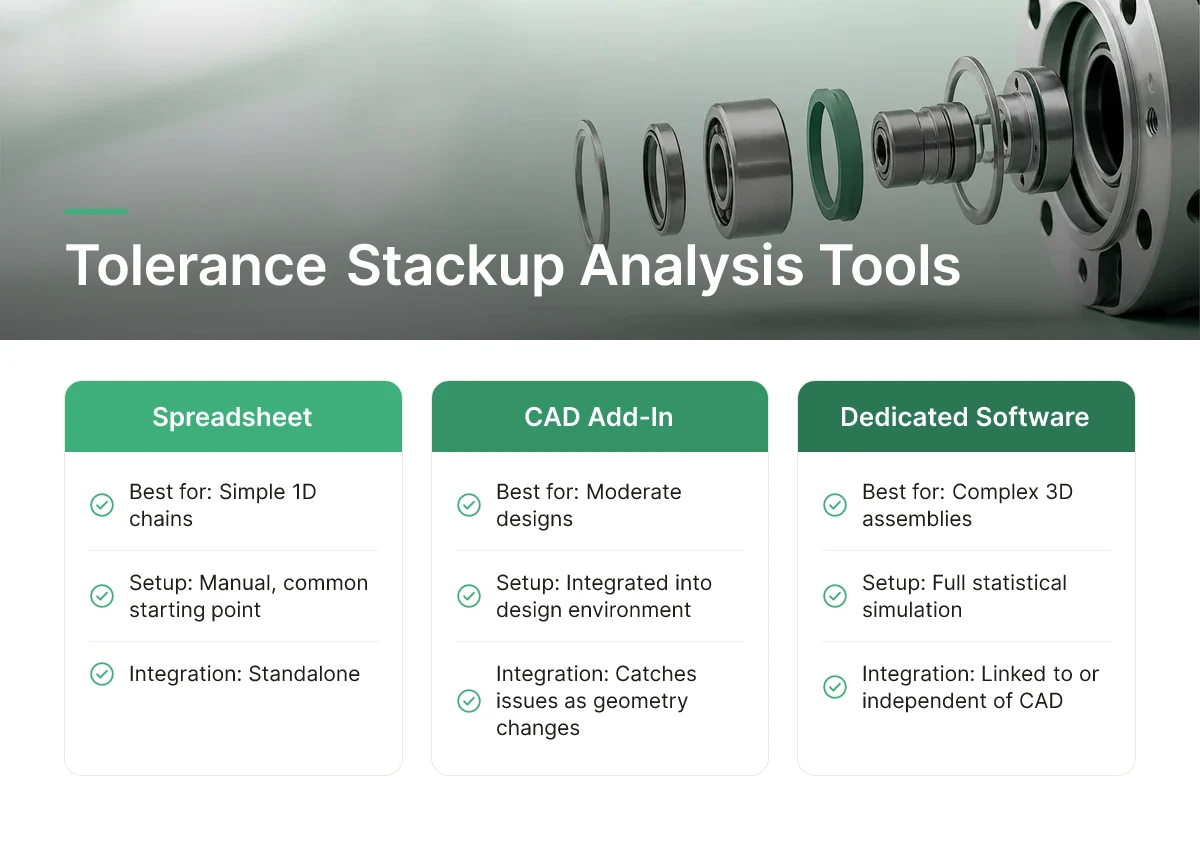
Match the tool to your assembly complexity and team workflow: spreadsheets suit simple 1D chains, CAD add-ins suit moderate designs, and dedicated software suits complex 3D assemblies run often.
Tools for tolerance stackup assembly work fall into three broad categories. Spreadsheet-based manual chains, usually built in Excel, remain the most common starting point for engineering teams. CAD-integrated add-ins layer tolerance checks directly into the design environment, catching issues as geometry changes. Dedicated tolerance analysis software runs full statistical simulation independent of, or linked to, your CAD system.
How do CETOL 6σ, EZtol, Enventive, and in-house solutions compare for your needs?
Packages like CETOL 6σ, EZtol, and Enventive automate stackup calculations and run Monte Carlo simulation across full 3D assemblies, something spreadsheets struggle to do reliably once a chain involves more than a handful of parts and geometric tolerances (position, profile, runout). These tools model variation propagation through complex geometry, flag contributors a manual worksheet would likely miss, and update automatically when a linked CAD model changes. In-house spreadsheet methods, by contrast, are built and understood entirely by your own team, every formula is visible, and there’s no dependency on a vendor’s calculation engine. That transparency is valuable for simple linear stacks with few dimensions, but it breaks down fast on assemblies with parallel tolerance loops or 3D vector chains, where hand-built worksheets become error-prone and hard to audit.
The tradeoff is straightforward. Spreadsheet-based analysis is budget-friendly and easy to trace but doesn’t scale well as stackups grow in dimensionality or part count. Dedicated tolerance software sits at a mid-range to premium investment, and that cost is typically justified through faster design iteration and fewer overlooked contributors, both of which reduce scrap and rework downstream, which is the real cost driver in precision assembly.
Base the decision on three factors: how complex your assemblies are (linear chains versus 3D geometric loops), how often you launch new products, and whether your team already works inside a CAD-integrated environment. A shop running occasional simple assemblies may never need dedicated software. A team pushing frequent new product introductions with tight GD&T requirements usually outgrows spreadsheets quickly. There’s no single right answer, match tool maturity to your part volume and complexity, and revisit the choice as your product mix changes. Whichever method you use, sharing worst-case and statistical results with your machining partner early helps confirm the tolerances are achievable before parts go into production. For those exploring tolerance stackup assembly, this matters.
Frequently Asked Questions
What is a tolerance chain in assembly design?
A tolerance chain is the sequence of individual part dimensions and their tolerances that combine to determine the final fit of an assembly. Each component in the chain contributes its own allowable variation, and the total stackup determines whether mating parts will fit, function, and assemble correctly across a full production run.
Can tighter tolerances always eliminate stackup problems?
No, tighter tolerances reduce stackup risk but don’t eliminate it and drive up machining cost and cycle time. A better fix is usually redesigning the tolerance chain itself—reducing the number of contributing dimensions or shifting critical tolerances to fewer, more controllable features.
How early in the design process should tolerance stackup analysis start?
Start stackup analysis during initial design, before the first prototype is machined. Catching fit and function problems on a CAD model costs far less than discovering them after parts are cut, and early analysis lets engineers adjust datums or tolerance allocation while changes are still cheap.
Does tolerance stackup analysis apply to 2D drawings, or only 3D CAD models?
It applies to both—stackup analysis started as a 2D worst-case calculation long before 3D CAD existed. Simple assemblies with linear dimensions can be checked directly on a 2D drawing, while complex geometries with geometric dimensioning and tolerancing (GD&T) callouts typically need 3D software to model angular and positional variation accurately.
Conclusion
Tolerance stackup problems get expensive when they surface at final assembly instead of at the drawing stage. The fix isn’t blanket tighter tolerances—it’s fewer contributing dimensions, clear datum strategy, and analysis run before parts are cut. For parts up to 38mm in diameter, MFG SOLUTION applies this discipline through ISO 9001:2015, ISO 13485:2016, and IATF 16949-certified process control, with 60+ engineering professionals reviewing tolerance chains before quoting. Next step: pull your current assembly drawing, list every dimension feeding your tightest fit, and check whether that chain has more contributing parts than it needs—then submit the print for a quote within 8 hours.
Recommended Articles
Explore more from our content library: