
2026-09-13
A Guide to Tolerance Stackup Analysis for Precision Parts
Tolerance stackup analysis is the process of calculating how individual part tolerances combine across an assembly to determine whether the final dimension will still meet the customer’s specification. Each machined feature carries its own tolerance range, and when several toleranced dimensions line up in a chain, their variation can add up—sometimes enough to push an assembly out of spec even though every individual part passed inspection. Engineers run this analysis before cutting metal, using worst-case, statistical (RSS), or Monte Carlo methods to predict the combined variation and set tolerances that keep parts functional, interchangeable, and inspectable at scale.
What Is Tolerance Stackup Analysis and Why Does It Matter for Precision Machining?
A dimensional chain is a sequence of toleranced part dimensions that connect end to end in an assembly, and each link in that chain adds its own variation to the final result.
Picture a housing with three machined spacers stacked inside it, followed by a shaft that has to seat against a retaining clip. Each spacer might carry a tolerance of ±0.05mm. On its own, that’s negligible. But stack three spacers plus the housing bore plus the shaft length together, and the gap where the clip needs to seat can vary far more than any single print callout suggests. That compounding effect is the dimensional chain, and it’s the reason a part that measures perfectly on a CMM can still cause an assembly to bind, rattle, or fail to close.
What is the purpose of tolerance stack-up analysis in the context of meeting customer specifications?
The purpose is to predict, before parts exist, whether components that each individually pass inspection will still fit and function once assembled together. A print’s tolerance callouts describe acceptable variation for one feature at a time. Tolerance stackup analysis translates those individual callouts into a prediction about the assembly as a whole, the bridge between “this dimension is in spec” and “this assembly works.” Without that bridge, a customer’s specification is just a set of disconnected numbers, each defensible on its own but untested as a system.
Skipping this step doesn’t save time, it moves the cost downstream and makes it larger. Parts that pass first-piece inspection can still fail at final assembly if nobody checked how their tolerances interact. That shows up as rework, scrapped batches, or line-down failures discovered only after tooling is committed and production is running. Catching an interference at final inspection, or worse, in the field after a medical or automotive customer has already installed the part, costs far more than catching it on paper.
That’s why stackup analysis belongs in design review, before tooling is cut and before a single chip comes off a machine. At MFG SOLUTION, this analysis runs alongside quoting and process planning, engineers review the print’s tolerance chain, flag any dimension combinations that risk exceeding the assembly’s functional limit, and confirm the chosen manufacturing method (CNC turning, Swiss lathe, cold forging, or mill-turn) can hold the tolerances the stackup requires before quoting the job.
How Do You Calculate Tolerance Stackup? Methods and When to Use Each
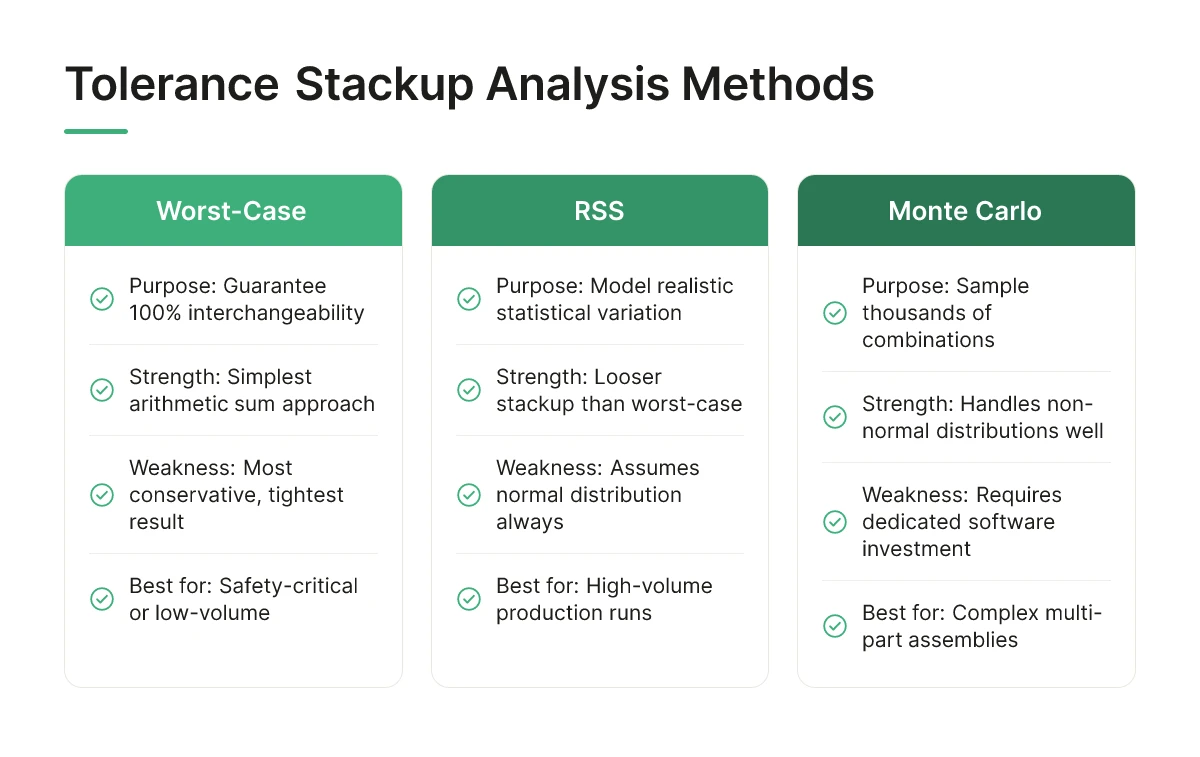
Three methods dominate tolerance stackup analysis: worst-case (arithmetic sum), RSS (statistical sum), and Monte Carlo (random sampling). Each trades conservatism for realism differently, and picking the right one depends on volume, risk, and assembly complexity.
What are the differences between worst-case, RSS (root sum square), and Monte Carlo methods for tolerance stackup?
Worst-case analysis adds every part tolerance in a stack together arithmetically, assuming every part lands at its extreme dimension simultaneously. It guarantees 100% interchangeability, every assembly built will fit, no exceptions, but it produces the tightest, most conservative tolerance band. In high-volume production, this often forces tighter (and costlier) machining tolerances than the assembly actually needs.
RSS combines tolerances by taking the square root of the sum of their squares, assuming each dimension varies according to a normal distribution around its nominal value. Because it’s statistically unlikely that every part in a stack hits its extreme at once, RSS yields a looser, more realistic result than worst-case. The tradeoff: a small percentage of assemblies could theoretically fall outside the calculated range, so RSS assumes a controlled, capable process behind each part.
Monte Carlo simulation runs thousands of randomly sampled combinations of part dimensions, pulling from the actual (or assumed) distribution of each tolerance, then tabulates how the full stack behaves. It handles non-normal distributions, skewed processes, and complex multi-part or nonlinear assemblies that worst-case and RSS math can’t model accurately. It requires more computation but produces the most defensible answer for complicated stacks.
How do you perform tolerance stack-up analysis with real numerical examples and step-by-step calculations?
Consider a simple linear stack of three machined parts fitting into a housing, each with a specified length and tolerance:
- Part A: 10.00 mm ± 0.05 mm
- Part B: 15.00 mm ± 0.03 mm
- Part C: 8.00 mm ± 0.04 mm
Worst-case calculation: Add the nominal dimensions (10.00 + 15.00 + 8.00 = 33.00 mm), then add the tolerances directly (0.05 + 0.03 + 0.04 = 0.12 mm). The stack result is 33.00 mm ± 0.12 mm, meaning the total assembly could range from 32.88 mm to 33.12 mm.
RSS calculation: Square each tolerance, sum the squares, then take the square root: √(0.05² + 0.03² + 0.04²) = √(0.0025 + 0.0009 + 0.0016) = √0.0050 ≈ 0.0707 mm. The RSS stack result is 33.00 mm ± 0.071 mm, roughly 40% tighter than the worst-case band, while still covering the statistically expected variation.
That gap between 0.12 mm and 0.071 mm is the entire point of running both calculations: it tells you how much margin exists between what’s mathematically guaranteed and what’s statistically probable.
Worst-case fits safety-critical assemblies (medical device housings, automotive fasteners) or low-volume runs where a single failed fit is unacceptable. RSS fits high-volume production where a controlled, repeatable process makes the statistical assumption reasonable. Monte Carlo earns its extra computation on assemblies with five or more stacked parts, non-normal tolerance distributions, or nonlinear relationships, geometric stacks, angular tolerances, or press-fit interference, where simple addition or square-root math breaks down. MFG SOLUTION’s engineering team applies these methods during design review on parts up to 38mm in diameter, matching the calculation approach to the part’s risk profile and production volume before committing to a machining process.
What Software and Tools Can Help You Perform Tolerance Stackup Analysis?
Three tool tiers cover almost every case: spreadsheets for simple linear stacks, CAD-integrated add-ins for model-tied analysis, and dedicated GD&T software for complex multi-directional assemblies.
How can I perform tolerance stack-up analysis in Excel, SolidWorks, or specialized GD&T software?
Excel remains the starting point for most shops, and there is nothing wrong with that. A worst-case or RSS (root-sum-square) stack is just a column of dimensions, tolerances, and a formula, every reviewer can trace the math line by line. The tradeoff is manual entry: every dimension gets typed in by hand, which means transcription errors creep in if someone reads a print wrong or misses a revision update.
CAD-integrated tools close that gap. SolidWorks TolAnalyst and comparable add-ins in other CAD packages pull tolerances directly from the model’s GD&T callouts, so the stack updates automatically when a designer changes a dimension. This matters most on assemblies with a dozen or more mating parts, where re-keying every value into a spreadsheet after each design revision becomes a real source of error, not just a nuisance.
Dedicated tolerance stackup software goes further, running Monte Carlo simulations across thousands of randomized dimension combinations to model realistic distributions instead of just best-case and worst-case extremes. These platforms handle multi-directional stacks, where tolerances compound across X, Y, and Z simultaneously rather than along a single axis, and are built for assemblies where dozens of parts and hundreds of features interact.
Which software tools are best suited for small precision parts, and what are their specific capabilities?
For parts up to 38mm in diameter with a handful of mating features, a well-built spreadsheet often does the job completely. Linear stacks, a shaft diameter into a bore, a shoulder length against a mating face, don’t need Monte Carlo simulation to validate; worst-case and RSS methods calculated manually give a defensible answer.
Dedicated software earns its place when part counts climb, geometries turn three-dimensional, or a customer’s spec calls for statistical process capability data alongside the stack. MFG SOLUTION’s engineering team applies this same judgment during quoting: simple turned or Swiss-machined components get spreadsheet-level analysis fast, while multi-feature mill-turn parts or medical assemblies get more rigorous review before the 8-hour quote goes out. Matching the tool to the part avoids paying for capability you don’t need, and avoids under-analyzing a stack that does.
What Common Mistakes Do Engineers Make in Tolerance Stackup Analysis?
Most stackup errors come from four repeatable habits: treating GD&T as plus/minus math, assuming normal distributions everywhere, omitting unlisted contributors, and skipping re-analysis after design changes.
Each mistake is easy to make under deadline pressure and easy to miss until parts fail to assemble on the production floor.
Mistake 1: Ignoring datum shifts and GD&T interactions
Simple worst-case addition of plus/minus tolerances treats every dimension as independent, but GD&T callouts rarely work that way. A position tolerance with a maximum material condition modifier can gain bonus tolerance as a feature departs from its stated size, and a datum shift at a secondary or tertiary datum can change how much of that bonus actually applies. An engineer who sums nominal tolerance bands without accounting for these interactions will calculate a tighter, or looser, stackup than the part actually experiences in the fixture.
Mistake 2: Assuming a normal distribution for every tolerance
Statistical stackup methods like root-sum-square depend on the assumption that each contributing dimension follows a normal distribution, but real manufacturing processes don’t always cooperate. A tool wearing steadily over a production run produces a skewed distribution, and a process running two machines or two shifts can produce a bimodal one. Applying root-sum-square math to a skewed or bimodal input understates the tails of the distribution and predicts a tighter fit than what actually ships.
Mistake 3: Leaving out contributing dimensions that aren’t on the print
A stackup model built only from print dimensions misses everything the print doesn’t show: fixture locating tolerances, assembly-induced deflection, gasket compression, and thermal expansion across dissimilar materials. A press-fit assembly that behaves perfectly at room temperature can bind or loosen once it reaches operating temperature if the analysis never accounted for differential expansion between an aluminum housing and a steel shaft.
Mistake 4: Never revisiting the stackup after a design change
A tolerance stackup analysis is a snapshot, not a permanent record, and a single revised dimension can quietly invalidate the entire chain. Engineering teams often tighten one tolerance to fix an unrelated fit issue without rechecking how that change ripples through the stack, the original analysis stays on file, unreviewed, while the part it describes no longer matches reality.
What assumptions in tolerance stackup analysis are most likely to fail in production, and how do you catch them early?
Distributional assumptions and datum interactions fail most often, catch them by cross-checking the stackup model against the actual GD&T scheme and real process capability data before release. At MFG SOLUTION, this means validating stackup assumptions against measured process capability from CNC turning, Swiss lathe, and cold forging lines before a part moves to production, rather than relying on generic tolerance tables that don’t reflect the specific process making the part.
How Do You Validate Tolerance Stackup Assumptions Through Testing and Production Data?
Validation closes the loop between paper calculations and real parts by comparing predicted stackup ranges against first-article inspection results, ongoing SPC data, and physical assembly trials.
What physical testing or production data methods confirm that your tolerance stackup analysis is correct?
The first checkpoint is first-article inspection. Before a batch runs, MFG SOLUTION measures the initial part against every dimension in the stackup model, checking that each feature falls inside its predicted range rather than just its individual print tolerance. A first article that passes on its own tolerances but sits at the extreme edge of the stackup’s predicted window is a warning sign worth flagging before the rest of the batch runs.
Statistical process control data gathered across a full production run tells a different story than a single first article can. SPC charts show whether the process actually centers where the stackup model assumed and whether the spread matches the distribution used in the calculation, typically a normal distribution for RSS-based stackups. If real variation is wider or skewed compared to what the math assumed, the calculated failure rate no longer holds, even if every part still passes its own print tolerance.
Functional gauging and assembly trials test what dimensional inspection alone cannot. A shaft and bore can each measure within print and still bind, wobble, or fail to seat correctly once assembled. Go/no-go gauges, mating-part trials, and full assembly builds confirm fit and function directly, which is the real target of any tolerance stackup analysis in the first place.
When production data disagrees with the model, three responses apply, roughly in order of preference: tighten the process (better fixturing, tool wear management, a different machining method), loosen or reassign a tolerance where the design allows slack, or revisit the stackup calculation itself if an assumption, worst-case versus RSS, or an overlooked contributor, turns out to be wrong.
None of this matters unless it protects what the customer actually specified. A stackup that looks clean in a spreadsheet but was never checked against first articles, SPC trends, or assembly trials is an assumption, not a validated result.
Frequently Asked Questions
What is the difference between tolerance and tolerance stackup?
A tolerance is the allowable variation on a single dimension; a tolerance stackup is the combined effect of multiple tolerances acting together. One feature’s tolerance might be ±0.05mm, but when five toe-to-toe dimensions each carry their own tolerance, the total variation at the final assembly point can be several times larger than any single value. Stackup analysis calculates that combined range before parts ever reach production.
Do you need tolerance stackup analysis for single-part features or only assemblies?
Stackup analysis matters most for assemblies, but multi-feature single parts need it too. Any part with several dimensions referencing a common datum, or features machined in separate setups, can accumulate variation the same way an assembly does.
How does GD&T relate to tolerance stackup analysis?
GD&T defines datums and tolerance zones precisely, which is the input data a stackup analysis depends on. Without clear datum structure, stackup calculations default to worst-case guesswork because there’s no consistent reference point for measuring how tolerances combine. Well-defined GD&T callouts let engineers trace exactly which features contribute to a given stackup, making the analysis repeatable across revisions and suppliers.
Can tighter individual tolerances eliminate the need for stackup analysis?
No, tighter tolerances reduce variation but don’t eliminate the need to check how dimensions combine. Even tight individual tolerances can stack into an out-of-spec assembly if the chain includes enough features. Analysis also reveals when tightening is unnecessary, saving cost without added risk.

Conclusion
Tolerance stackup analysis works best when it happens before parts are cut, not after an assembly fails to fit. Build the tolerance chain from your GD&T datums, choose worst-case or statistical methods based on production volume, and re-run the analysis whenever a drawing revision changes a reference dimension.
If you’re sourcing parts up to 38mm in diameter and need a manufacturing partner who can catch stackup issues during design review rather than after delivery, submit your print to MFG SOLUTION for a quote within 8 hours, engineering review is part of that process, not an extra step.
Recommended Articles
Explore more from our content library: