
2026-08-11
Advanced Tolerance Stackup Calculation Methods

Tolerance stackup calculation is the process of adding up all the individual dimensional tolerances in an assembly to determine the total accumulated variation at a critical gap, clearance, or fit. Engineers use three main methods, worst-case, RSS (root sum square), and Monte Carlo, to predict whether parts will assemble correctly across an entire production run. Catching stackup problems before manufacturing begins prevents costly rework, field failures, and scrapped assemblies.
ISO Tolerance
ISO 286 limit deviations and fit types for bore and shaft.

What Is Tolerance Stackup Calculation and How Does It Work in Design?
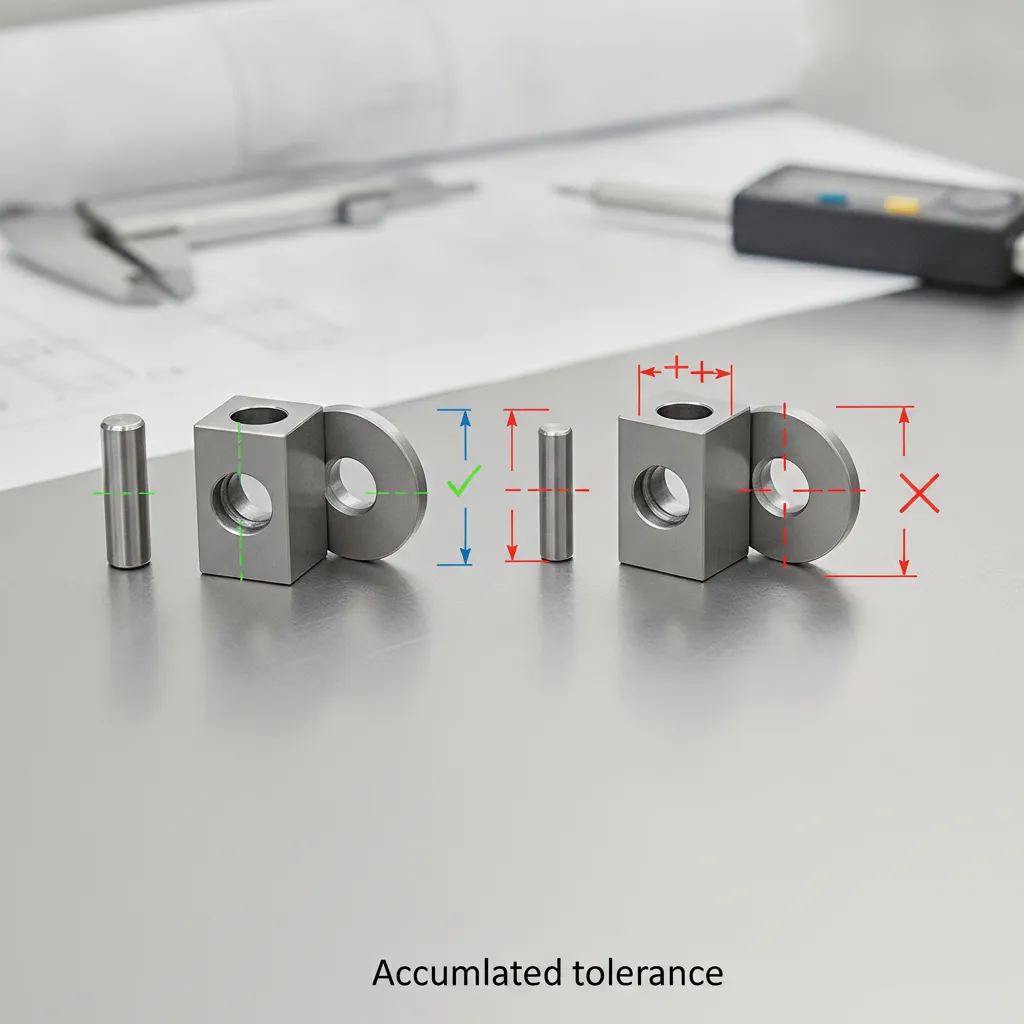
Tolerance stackup calculation quantifies the cumulative dimensional variation across all parts in an assembly, predicting the total error at a critical feature like a gap or fit.
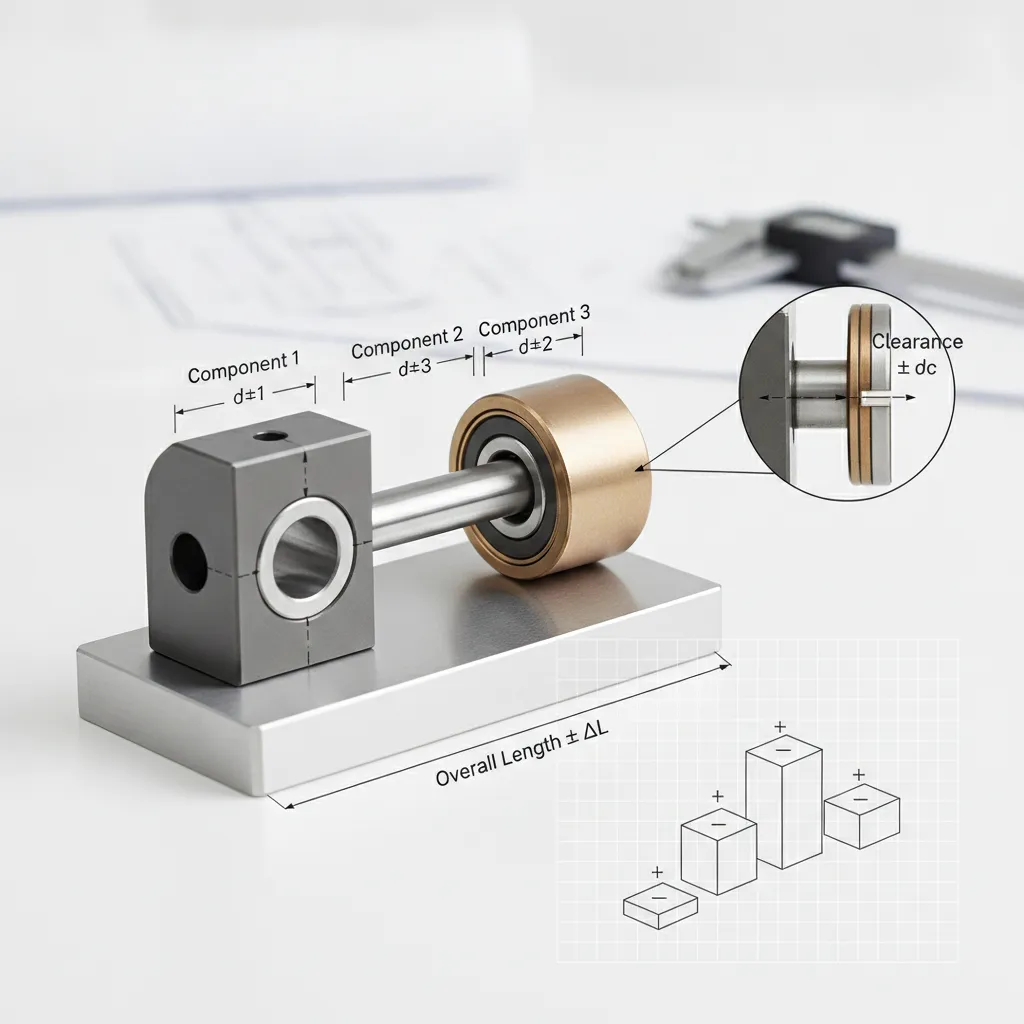
Every machined part carries a tolerance, a permitted deviation from its nominal dimension. When multiple parts assemble together, those deviations add up along a dimensional loop: a closed chain of part features that starts and ends at the functional requirement you are trying to control. That requirement might be a minimum air gap of 0.05 mm between a rotor and housing, or a maximum interference of 0.02 mm in a press-fit joint. Each part in the chain contributes its own tolerance to the loop, and the loop “closes” at that functional requirement. If the accumulated variation exceeds the allowed limit, the assembly fails, even when every individual part is within its own specification.
Dimensional variation is a root cause in over 30% of assembly failures in precision manufacturing, according to a 2019 American Society for Quality study. Identifying stackup problems before production begins is far cheaper than sorting or reworking finished assemblies.
According to the American Society of Mechanical Engineers (ASME), proper tolerance analysis is a foundational requirement for ensuring dimensional integrity in precision assemblies. For a deeper treatment of the full analysis process, see our Precision Tolerance Stackup: A Complete Guide. Note that surface finish CNC machining is a downstream variable that directly affects actual part dimensions, a surface roughness specification changes the effective contact geometry and should be accounted for in any stackup model.
Why Tolerance Stackup Matters for Manufacturing and Product Reliability
A single out-of-spec part rarely causes an assembly failure in isolation. The real risk is compounding: three parts each at the edge of their tolerance band can push a critical gap outside its functional limit even though each part passed incoming inspection. Catching that scenario on paper, before tooling is cut or batch production begins, is the entire purpose of a stackup calculation.
“Tolerance analysis is not just about checking whether parts fit — it is about understanding the probability that they will fit across thousands of assemblies under real manufacturing variation.” — Paul Drake, Author of Dimensioning and Tolerancing Handbook, McGraw-Hill
Tolerance Stackup in GD&T Versus Traditional Dimensioning
Traditional coordinate dimensioning assigns a ± value to each linear dimension. GD&T-based stackup uses geometric controls, position, perpendicularity, runout, that more accurately describe how a feature varies in three-dimensional space. GD&T typically produces tighter, more realistic stackup results because it accounts for the actual functional relationship between features rather than treating each dimension independently. A position tolerance, for example, controls a hole’s location within a circular tolerance zone, which gives back usable tolerance that a ± coordinate system discards. For high-precision parts under 38 mm diameter, the range MFG SOLUTION machines daily, choosing GD&T-based stackup can mean the difference between a design that assembles reliably at volume and one that requires 100% inspection sorting.
The Three Main Methods for Tolerance Stackup Calculation Compared
Worst-case, RSS, and Monte Carlo are the three standard tolerance stackup calculation methods, each trades assembly yield guarantee against manufacturing cost differently. According to Simplexity Product Development’s overview of the three steps of tolerance analysis, selecting the right method depends heavily on production volume and the criticality of the assembly.
Worst-Case Method
Worst-case analysis sums all tolerances arithmetically: Total = T1 + T2 + T3 … Tn. Three parts each holding ±0.05 mm produce a stackup of ±0.15 mm, the absolute maximum gap or interference possible. Every assembly passes, guaranteed, but the method forces tight individual tolerances that drive up machining cost, especially across long chains of components.
RSS Method
Root Sum Square (RSS) uses the formula Total = √(T1² + T2² + T3²). Those same three ±0.05 mm tolerances yield ±0.087 mm, a 42% reduction versus worst-case. RSS assumes a normal distribution across the production population, so it’s appropriate when Cpk ≥ 1.33 and volumes exceed roughly 1,000 units. Below that threshold, the statistical assumptions stop holding and you risk real assembly failures.
Monte Carlo Method
Monte Carlo runs 10,000–100,000 simulated assemblies, sampling from your actual measured process distributions. The output is a predicted yield percentage and a histogram, not just a single number. This method is best for complex 3D assemblies or when your process data shows non-normal distributions that RSS cannot model accurately. For a visual walkthrough of Monte Carlo simulation applied to tolerance analysis, this YouTube tutorial on tolerance stackup simulation provides a helpful introduction.
When to Use Worst-Case Analysis Versus Statistical Methods Like RSS
The choice follows part criticality and production volume. Use worst-case for safety-critical or low-volume applications, medical implants, aerospace fasteners, where a single failure is unacceptable. Use RSS for high-volume commercial assemblies where Cpk data is available and controlled. Apply Monte Carlo when you have real process Cpk data and need yield predictions at or above 99.73% (6-sigma).
| Method | Formula | Example Result | Best Use Case | Risk |
|---|---|---|---|---|
| Worst-Case | T1 + T2 + T3 | ±0.15 mm | Medical, aerospace, low volume | Over-tightened tolerances; higher cost |
| RSS | √(T1² + T2² + T3²) | ±0.087 mm | High-volume commercial assemblies | Yield failures if Cpk < 1.33 |
| Monte Carlo | Simulation (10K–100K runs) | Yield % + histogram | Complex 3D or non-normal processes | Requires accurate process distribution data |
How to Perform a 1D Tolerance Stackup Analysis Step by Step
A 1D tolerance stackup calculation follows five steps: define the requirement, draw the loop, list contributors, apply the formula, then evaluate and adjust.
The Basic Formula for Calculating Tolerance Stackup
Step 1, Define the functional requirement. Identify the critical dimension your assembly must satisfy. A common example: the minimum clearance between a shaft and housing must be ≥ 0.02 mm. Without a concrete pass/fail threshold, the analysis has no target.
Step 2, Draw the tolerance loop. Sketch a closed loop diagram from datum to datum. Assign a positive (+) direction to dimensions that increase the gap and a negative (−) direction to dimensions that close it. Every contributing dimension must appear in the loop, missing one invalidates the result. For more information, see Thegoodcode.
Step 3, Apply the formula. Once the loop is complete, calculate:
- Nominal Gap = Σ(positive nominals) − Σ(negative nominals)
- Worst-Case Tolerance = Σ|Ti|
- RSS Tolerance = √(ΣTi²)
Worked example: five parts with individual tolerances of ±0.02, ±0.02, ±0.01, ±0.02, and ±0.01 mm produce a nominal gap of 0.10 mm. Worst-case tolerance = ±0.08 mm; RSS tolerance = ±0.04 mm. The RSS result is the more statistically realistic figure for production runs.
How to Fill Out and Organize a Tolerance Stackup Spreadsheet
Step 4, Build the spreadsheet. Create a table with these columns: Item No. | Part Name | Nominal | Tolerance | Direction (+/−) | Contribution. A free Excel template with pre-built worst-case and RSS formulas is a practical starting point, it eliminates manual summation errors and makes tolerance sensitivity visible at a glance.
Step 5, Evaluate and adjust. Compare your worst-case result against the functional requirement. If the gap falls below 0.02 mm, tighten the largest tolerance contributors first, the Pareto principle applies here, since the top two or three dimensions typically account for most of the total variation. Alternatively, redesign the assembly loop to reduce the number of contributing parts. CNC threading is one process where this adjustment is direct: stackup errors affect thread engagement length, which determines whether a fastened joint meets pull-out strength requirements.
At MFG SOLUTION, parts produced via CNC turning and Swiss lathe machining are held to tolerances tight enough to keep individual contributions small, which reduces worst-case stackup risk before the design even reaches the adjustment step.
Common Inputs Required for a Complete Stackup Analysis
Before beginning any tolerance stackup calculation, engineers should gather the following inputs to ensure the analysis is complete and accurate:
- Nominal dimensions for every part in the assembly loop
- Bilateral or unilateral tolerances for each contributing dimension
- GD&T callouts (position, perpendicularity, flatness) with their applicable modifiers
- Process Cpk data for each manufacturing operation, if RSS or Monte Carlo methods will be used
- Datum reference frame definitions and fixturing constraints
- The functional requirement (minimum clearance, maximum interference, or target fit)
- Material and thermal expansion coefficients for assemblies subject to temperature variation
“The most common mistake in tolerance stackup is not the math — it is failing to identify every contributor to the loop. Engineers routinely omit form tolerances, datum shift, and fixturing variation, then wonder why the assembly fails at the rate the analysis said it would not.” — James D. Meadows, President, Institute for Engineering and Design, and author of Geometric Dimensioning and Tolerancing
How GD&T Integrates with Tolerance Stackup Calculations
GD&T tolerances feed directly into tolerance stackup calculations, but each geometric control requires conversion before it enters the loop.
How Geometric Tolerances Like Position and Perpendicularity Affect Stackup
A true position callout such as ⌀0.1 mm defines a diametrical tolerance zone, not a bilateral one. Before that value enters a stackup, you must convert it: ⌀0.1 mm becomes ±0.05 mm in each axis. Skipping this conversion overstates or understates the contribution depending on which axis drives the critical gap.
Perpendicularity and flatness tolerances add form and angular variation that compounds with linear dimensions. In tall, stacked assemblies, think a column of spacers or a multi-plate fixture, ignoring these geometric controls can underestimate total variation by 15–25%. A 1D stackup that treats every part as perfectly square will miss that error entirely.
MMC modifiers change the calculation further. When a position tolerance is called out at Maximum Material Condition, bonus tolerance becomes available as the feature departs from MMC. That bonus is a real, calculable value you can add to the stackup, which often reduces the precision required from individual parts without compromising assembly function.
CNC hole drilling technology directly affects true position results. Tighter spindle runout and rigid fixturing on a 5-axis machine produce position errors closer to zero, which means the converted ±value entering your stackup is smaller and your assembly gap budget opens up. MFG SOLUTION’s 5-axis CNC machines and Swiss lathe equipment are configured to hold true position within the ranges that medical and automotive assemblies demand.
The National Institute of Standards and Technology (NIST) publishes dimensional metrology guidelines that inform how geometric tolerances should be measured and verified before they are used as inputs in a stackup model.
The Role of Datum Reference Frames in GD&T-Based Stackup
The datum reference frame you select determines which surfaces anchor the stackup loop, and that choice changes the result. Switching from Datum A, a flat face, to Datum B, a bore centerline, can shift the stackup result by the full form tolerance of Datum A. If that face has a flatness tolerance of 0.05 mm, the entire stackup shifts by that amount when you change the datum.
Choosing datums that reflect how the assembly actually locates and loads in service keeps the stackup grounded in physical reality. For GD&T-specific depth on datum selection and feature control frames, the How to Manage Tolerance Stackup in Precision Parts page covers those details for engineers working through complex multi-datum assemblies.
Software Tools and Templates for Tolerance Stackup Analysis
The right tool for tolerance stackup calculation depends on assembly complexity, your CAD environment, and budget, Excel handles simple 1D checks; dedicated software handles the rest.
SolidWorks TolAnalyst vs NX vs Standalone Tools: Pros and Cons
SolidWorks TolAnalyst runs 1D and 2D stackup directly inside the SolidWorks CAD environment. Engineers skip data re-entry and get automatic loop detection, a real time-saver on multi-part assemblies. The drawbacks: it supports only worst-case and RSS methods, has no Monte Carlo capability, and requires a SolidWorks Premium license priced at roughly $8,000–$12,000 per seat.
Siemens NX Tolerance Analysis supports full 3D statistical analysis and Monte Carlo simulation, making it suitable for complex assemblies where yield prediction matters. It integrates tightly with NX CAD/CAM workflows. The cost, typically $15,000+ per seat, and a steep learning curve make it overkill for straightforward 1D problems.
Standalone tools such as Sigmetrix CETOL 6σ and VisVSA are purpose-built for tolerance analysis. They are CAD-agnostic, support Monte Carlo and sensitivity analysis, and produce detailed yield reports. The trade-off is additional software cost and training time on top of your existing CAD investment.
Excel Templates and Calculator Tools for Tolerance Stackup
A well-structured spreadsheet covers the majority of 1D stackup problems at zero or near-zero cost. Pre-built worst-case and RSS formulas do the arithmetic; engineers focus on inputs. Include these columns as a minimum: Part, Nominal, Tolerance, Direction, Contribution, and Cumulative.
Excel templates work best as a quick sanity check before committing to tighter tolerances in a drawing, or in shops that lack dedicated CAD-integrated tools entirely. The Society of Manufacturing Engineers (SME) offers resources and training on tolerance analysis tools and best practices for manufacturing engineers at all levels.
| Tool | Best For | Method Support | Approx. Cost |
|---|---|---|---|
| Excel Template | 1D quick checks | Worst-case, RSS | Free–low |
| SolidWorks TolAnalyst | SolidWorks shops, 1D–2D | Worst-case, RSS | ~$8,000–$12,000/seat |
| CETOL 6σ / VisVSA | Complex 3D, yield prediction | Monte Carlo, sensitivity | Varies; mid-to-high |
| Siemens NX | Large assemblies, NX shops | 3D statistical, Monte Carlo | ~$15,000+/seat |
Documented stackup analysis, regardless of which tool produces it, supports ISO 9001:2015 quality system compliance. At MFG SOLUTION, our 60+ engineering professionals review customer stackup data before production to confirm that part tolerances, as machined on our 5-axis CNC equipment, will meet assembly requirements without rework.
Frequently Asked Questions
What is the basic formula for tolerance stackup calculation?
The worst-case formula is: Gap = Nominal Dimension ± (T1 + T2 + T3 + … Tn), where each T represents an individual part tolerance in the assembly loop. For a statistical (RSS) approach, the total tolerance equals the square root of the sum of each individual tolerance squared. Worst-case guarantees fit at all extremes; RSS predicts fit at a defined confidence level—typically 99.73% at ±3 sigma—and usually yields a larger allowable tolerance per part, reducing manufacturing cost.
How many parts in an assembly make tolerance stackup analysis necessary?
Any assembly with two or more mating parts benefits from a stackup analysis. Even a two-part fit—a shaft inside a bore—can fail if each part is produced at its tolerance limit simultaneously. As part count rises above three or four, cumulative error grows fast enough that skipping the analysis almost guarantees interference or excessive clearance in production runs.
Can tolerance stackup calculation be applied to 3D assemblies, or only 1D?
Tolerance stackup applies to 1D, 2D, and 3D assemblies, though the math grows more complex with each added dimension. A 1D stackup sums tolerances along a single axis. A 2D or 3D stackup accounts for angular relationships, datum shifts, and geometric tolerances—often requiring vector-loop analysis or dedicated software. Most precision assemblies need at least a 2D analysis to capture how perpendicularity and angularity errors contribute to the critical gap or clearance.
How does process capability (Cpk) affect which tolerance stackup method you should use?
A high Cpk—1.33 or above—means your manufacturing process consistently holds parts near the nominal, making RSS analysis appropriate and statistically valid. If Cpk falls below 1.0, parts cluster toward tolerance limits and worst-case analysis is the safer choice. Before committing to RSS, confirm the Cpk of each contributing process. Suppliers certified to IATF 16949, for example, are required to document Cpk values, giving you the data needed to choose the right method with confidence.
What is a real-world example of a tolerance stackup failure and how was it corrected?
A common example is a medical device housing where four stacked plastic components each carry a ±0.1 mm length tolerance. Worst-case stackup gives ±0.4 mm total—enough to prevent a PCB from seating against its connector. The fix typically involves one of three corrections: tightening one critical tolerance, redesigning a component to absorb variation (a compliant snap feature, for instance), or switching to a datum reference that shortens the tolerance loop. Reducing the number of parts in the loop is the most cost-effective solution when redesign is possible.
Conclusion
Tolerance stackup calculation is not a one-time design check—it is a discipline that runs from initial concept through production validation. Three actions make the biggest difference: choose your method (worst-case or RSS) based on documented Cpk data, not habit; minimize the number of parts in each tolerance loop before tightening any individual tolerance; and verify that your datum structure matches how parts are actually fixtured on the machine.
If you are sourcing precision parts for a stackup-sensitive assembly, submit your stack diagram alongside your part drawings when requesting a quote. MFG SOLUTION’s engineering team—60+ professionals certified to ISO 9001:2015, ISO 13485:2016, and IATF 16949—reviews specifications within 8 hours and can flag process capability concerns before a single part is cut.
Recommended Articles
Explore more from our content library: